This function visualizes the sites surveyed for breeding birds in Taiwan, highlighting the presence and absence of specific species. It is designed upon the function bbs_fetch and bbs_translate.
Arguments
- target_species
Character string specifying the scientific name of the species of interest. It can accept a single character string, such as
target_species = "紅嘴黑鵯", or a vector, such astarget_species = c("紅嘴黑鵯", "白耳畫眉"). The function can accept up to plotting 5 species in one figure. UseNULLto return a map of site distribution.
Examples
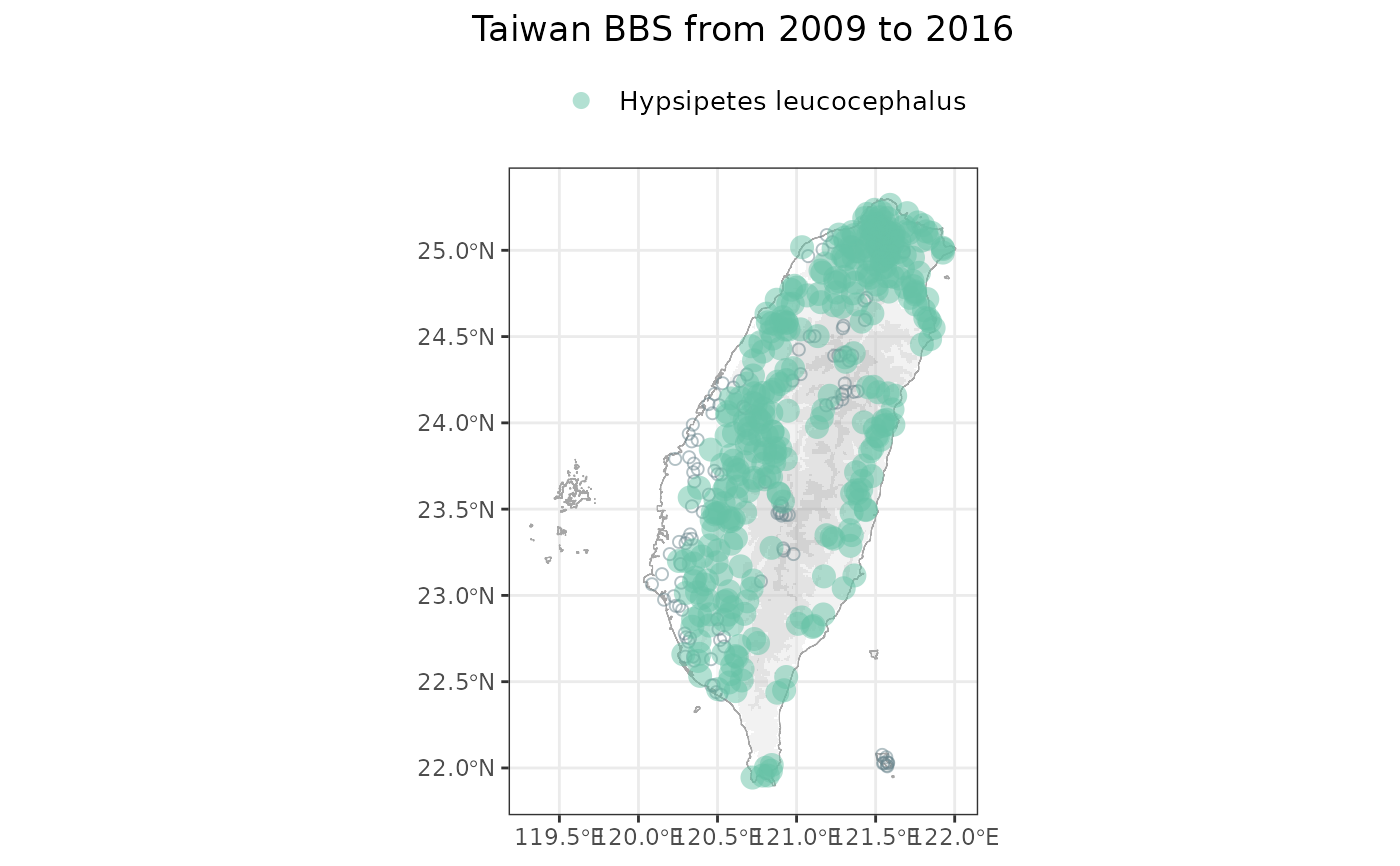
# For single species distribution
bbs_plotmap(target_species = "紅嘴黑鵯")
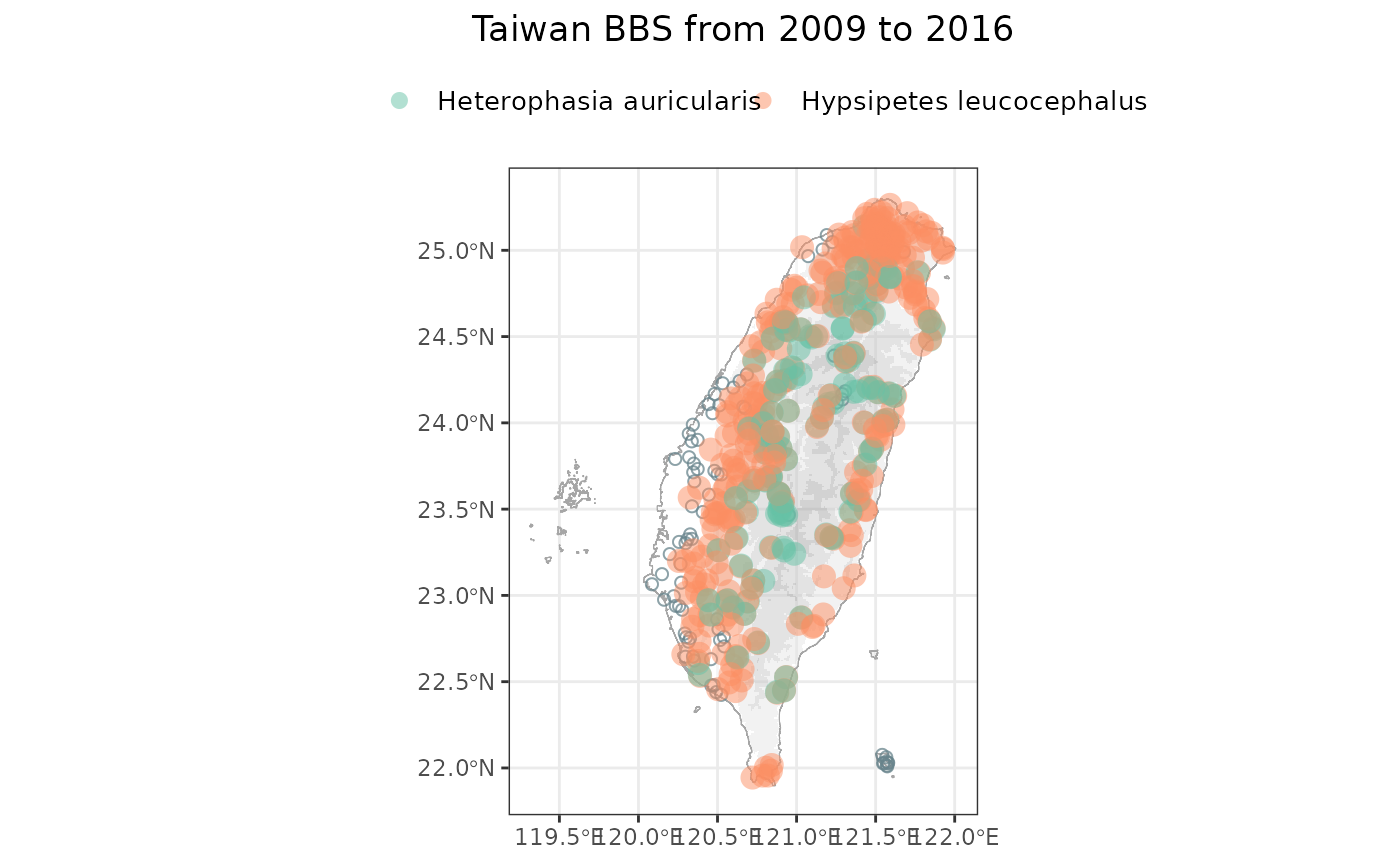
 # For multiple species distribution
bbs_plotmap(target_species = c("紅嘴黑鵯", "白耳畫眉"))
# For multiple species distribution
bbs_plotmap(target_species = c("紅嘴黑鵯", "白耳畫眉"))
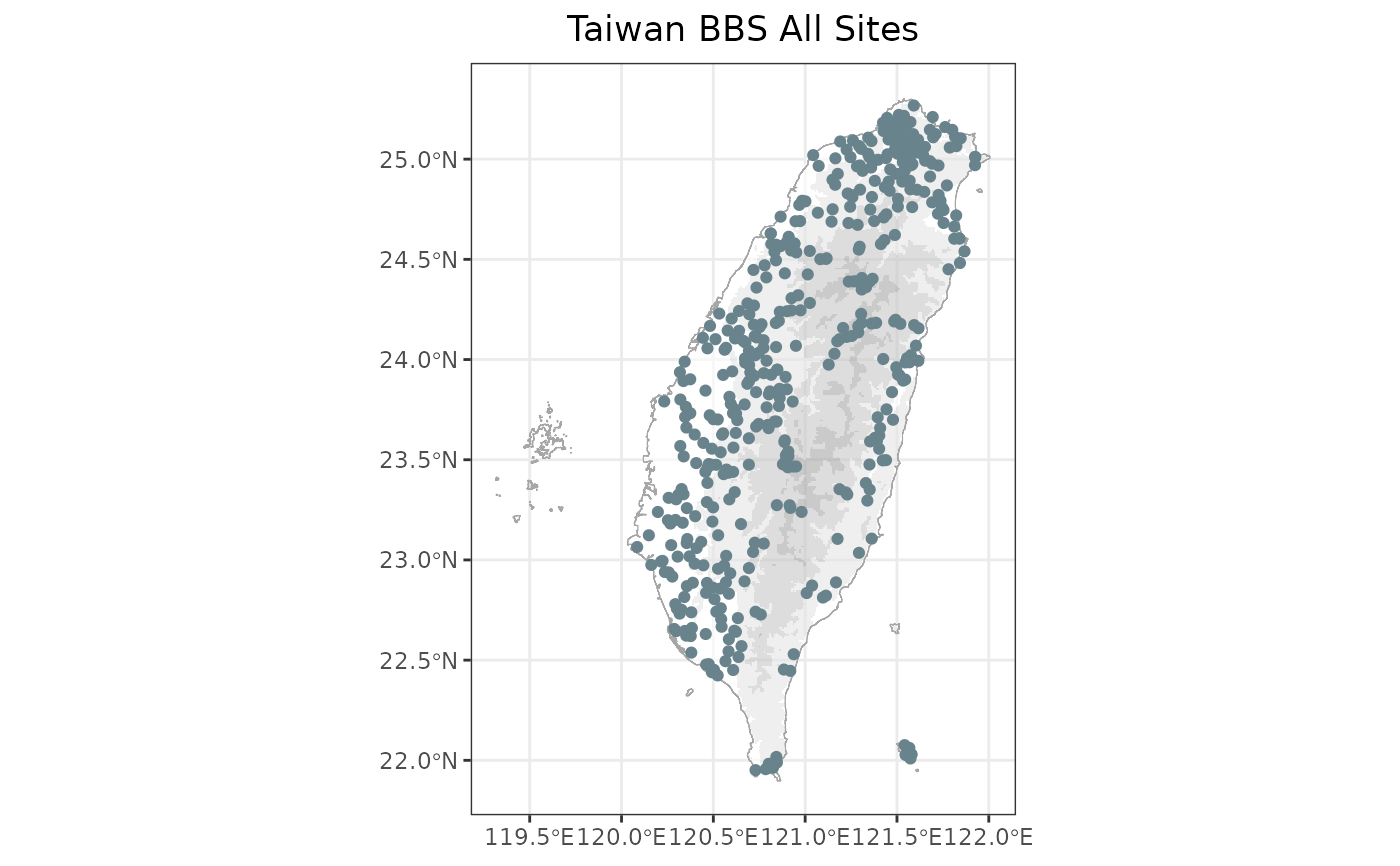
 # Simply the distribution of the surveyed sites
bbs_plotmap(target_species = NULL)
# Simply the distribution of the surveyed sites
bbs_plotmap(target_species = NULL)