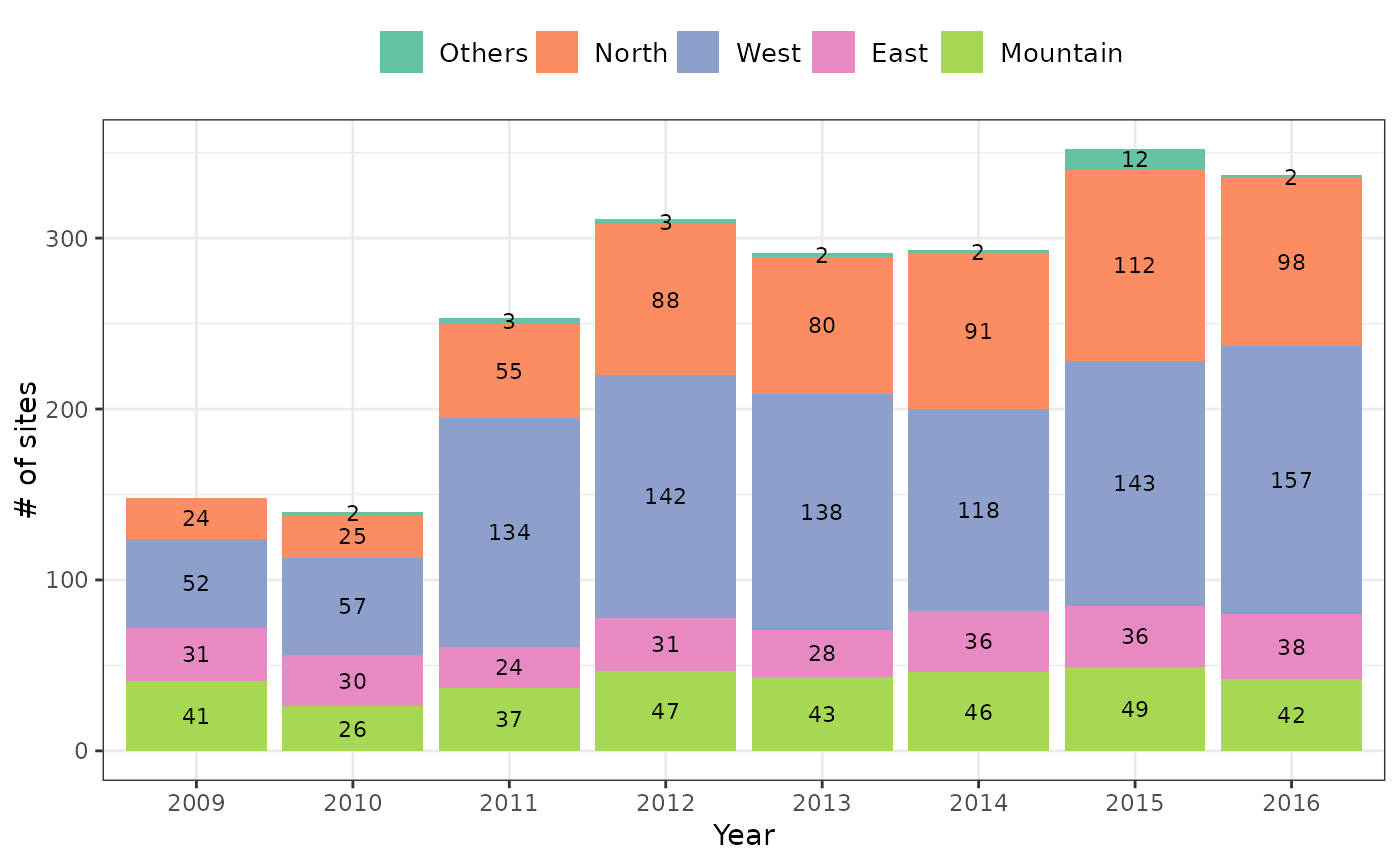
This function returns the number of sites surveyed each year in the BBS Taiwan project. Sites were mapped into five regions: East, West, South, North, and Mountain (elevation higher than 1,000 m).
Examples
# Return the number of sites in a table
bbs_history(type = "table")
#> # A tibble: 8 × 6
#>   year   East Mountain North  West Others
#>   <chr> <int>    <int> <int> <int>  <int>
#> 1 2009     31       41    24    52      0
#> 2 2010     30       26    25    57      2
#> 3 2011     24       37    55   134      3
#> 4 2012     31       47    88   142      3
#> 5 2013     28       43    80   138      2
#> 6 2014     36       46    91   118      2
#> 7 2015     36       49   112   143     12
#> 8 2016     38       42    98   157      2

# Return the number of sites in a bar chart
bbs_history(type = "plot")